HoLLIE – week 2
/The second HoLLIE (Howard County Legacy Leadership for the Environment) class day was last week and it was held at NASA Goddard. I was worried about hitting rush hour traffic so left very early since we were to meet in the Goddard Visitor Center parking lot to catch the bus into the facility. The day was sunny and clear…but very cold and breezy. I managed to take this picture of the visitor center (not yet open) without getting out of my car!

The theme for the day was “what informed citizens need to know about earth systems science.” It was the first of two days that our classes will be at Goddard; last week we started with lectures on “understanding the tools and the state of the art in earth science” from the Project Scientist for the AQUA satellite and then got a tour of mission control for several earth science satellites from the Aqua Mission Director. They did a good job of demonstrating the types of data that can be collected, the methods used to collect it, and the ways it has been analyzed. I was surprised to see the LRO (Lunar Reconnaissance Orbiter) mission control in the same building. That brought back the memory of my daughter being on the team to do image calibration shortly after it launched during her undergraduate days!

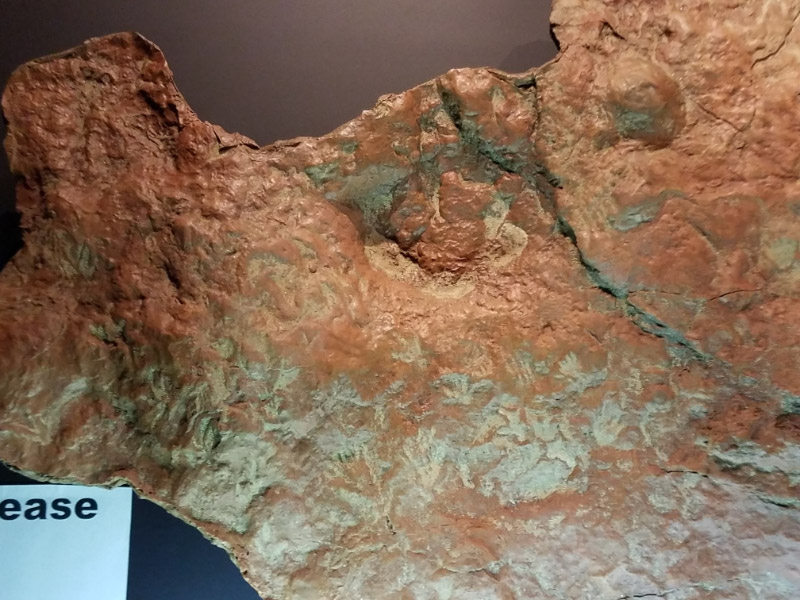
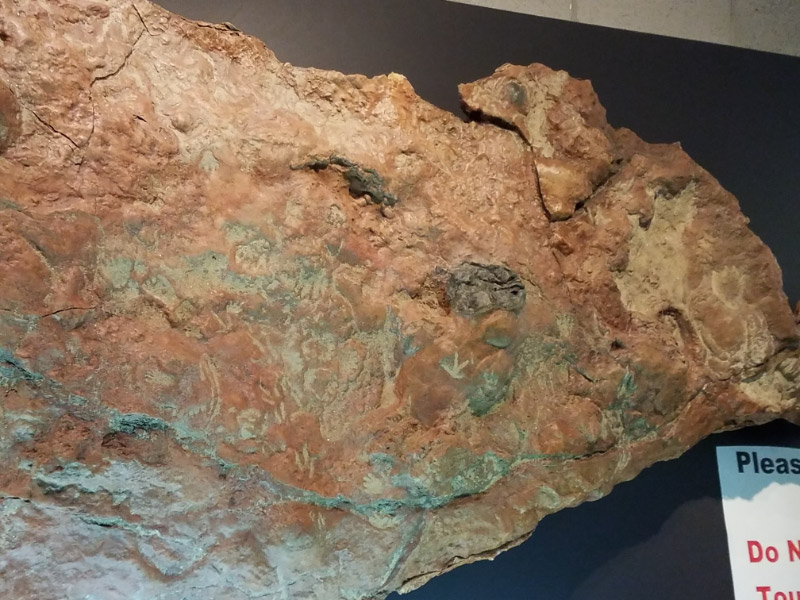
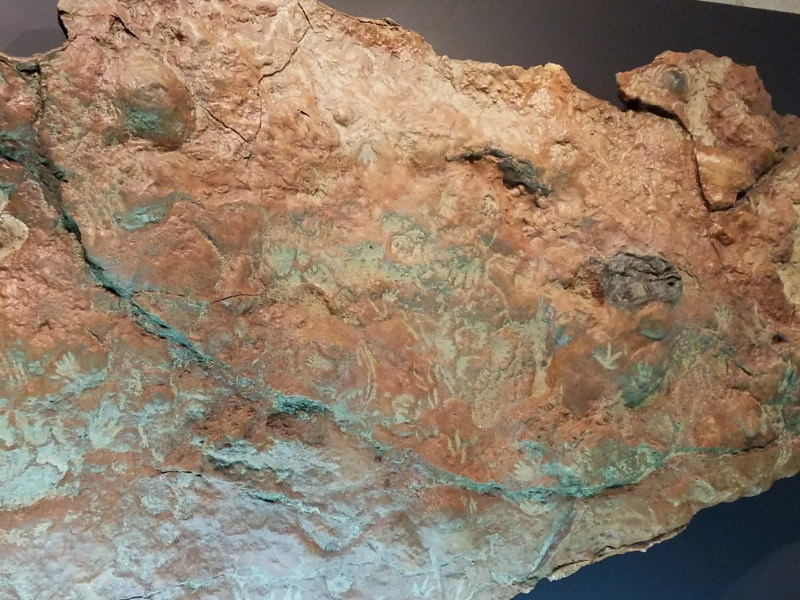
On the way back to our classroom, we stopped by the replica of the big rock found at Goddard that has mammal and dinosaur and mammal tracks. This was not on our agenda originally but was a wonderful serendipity aspect to the day even if it took part of our lunch time. I’d read about it in one of my news feeds and followed the link to the paper…but it was such a thrill to see the exhibit and hear the short lecture. I managed to take a few pictures.
We started the lectures on ‘understanding the science of earth’s cycles’ that will continue in this week’s class. We talked about the oceans and the carbon system in this second class. One of the interesting videos in the lectures is available online: twenty years of global biosphere data mapped on a slowly spinning globe; it easy to see the annual cycles. With the massive amounts of data, visualization becomes an important component.

When I got home an article in one of my newsfeeds talked about climate models that are developing that explain why there might be a linkage between melting of Arctic sea ice (one of the topics for the HoLLIE lectures this week) and droughts in California (How nuclear weapons research revealed new climate threats). It was easier to understand since I had the background of the lectures!
Previous HoLLIE posts: Week 1